Task1 论文数据统计
任务说明
- 任务主题:论文数量统计,即统计2019年全年计算机各个方向论文数量;
- 任务内容:赛题的理解、使用 Pandas 读取数据并进行统计;
- 任务成果:学习 Pandas 的基础操作;
- 可参考的学习资料:开源组织Datawhale joyful-pandas项目
数据集介绍
- 数据集来源:数据集链接;
- 数据集的格式如下:
id:arXiv ID,可用于访问论文;submitter:论文提交者;authors:论文作者;title:论文标题;comments:论文页数和图表等其他信息;journal-ref:论文发表的期刊的信息;doi:数字对象标识符,https://www.doi.org;report-no:报告编号;categories:论文在 arXiv 系统的所属类别或标签;license:文章的许可证;abstract:论文摘要;versions:论文版本;authors_parsed:作者的信息。
一、加载数据
导入 package
# 导入所需的package
import seaborn as sns #用于画图
from bs4 import BeautifulSoup #用于爬取arxiv的数据
import re #用于正则表达式,匹配字符串的模式
import requests #用于网络连接,发送网络请求,使用域名获取对应信息
import json #读取数据,我们的数据为json格式的
import pandas as pd #数据处理,数据分析
import matplotlib.pyplot as plt #画图工具
读取 json 文件
data = []
with open("../data/arxiv-metadata-oai-snapshot.json", 'r') as f:
    for line in f:
        data.append(json.loads(line))
data = pd.DataFrame(data)
data.shape
(1796911, 14)二、数据预处理
筛选出指定的列和2019年后的数据
data = data[['id', 'categories', 'update_date']]
print(data.shape)
data.head()
(1796911, 3)
data.groupby(["categories", "year"])
data.reset_index(drop=True, inplace=True)
print(data.shape)
data.head()| id | categories | year | |
|---|---|---|---|
| 0 | 0704.0297 | astro-ph | 2019 |
| 1 | 0704.0342 | math.AT | 2019 |
| 2 | 0704.0360 | astro-ph | 2019 |
| 3 | 0704.0525 | gr-qc | 2019 |
| 4 | 0704.0535 | astro-ph | 2019 |
Describe 粗略描述
data.describe()| id | categories | update_date | |
|---|---|---|---|
| count | 1796911 | 1796911 | 1796911 |
| unique | 1796907 | 62055 | 4095 |
| top | math-ph/0408005 | astro-ph | 2007-05-23 |
| freq | 2 | 86914 | 130748 |
以上的结果表明:共有1796911个数据,有62055个子类(因为有论文的类别是多个,例如一篇paper的类别是CS.AI & CS.MM和一篇paper的类别是CS.AI & CS.OS属于不同的子类别,这里仅仅是粗略统计),其中最多的种类是astro-ph,即Astrophysics(天体物理学),共出现了86914次。
由于部分论文的类别不止一种,所以下面我们判断在本数据集中共出现了多少种独立的数据集。
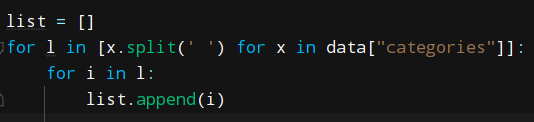
列表推导式
unique_categories = set([i for l in [x.split(' ') for x in data["categories"]] for i in l])
len(unique_categories)
unique_categories
这里最开始没有理解是因为 [x.split(' ') for x in data["categories"]] 这一块作为了迭代的对象,把它看作一个整体就是一个双层标准的列表推导式了。
就常见的三种普通循环、列表推导式、map()函数效率来说,列表推导式的效率最高,其次是map()函数,正常的for循环效率是最低的,这一点尤其在解决大循环量问题时较为明显。
补充
在生成一个数字序列的时候,在 Python 中可以如下写出:
In [1]: L = []

In [2]: def my_func(x):
   ...:     return 2*x
   ...:

In [3]: for i in range(5):
   ...:     L.append(my_func(i))
   ...:

In [4]: L
Out[4]: [0, 2, 4, 6, 8]
事实上可以利用列表推导式进行写法上的简化: [* for i in *] 。其中,第一个 * 为映射函数,其输入为后面 i 指代的内容,第二个 * 表示迭代的对象。
In [5]: [my_func(i) for i in range(5)]
Out[5]: [0, 2, 4, 6, 8]
列表表达式还支持多层嵌套,如下面的例子中第一个 for 为外层循环,第二个为内层循环:
In [6]: [m+'_'+n for m in ['a', 'b'] for n in ['c', 'd']]
Out[6]: ['a_c', 'a_d', 'b_c', 'b_d']
三、数据可视化
Pandas 数据处理
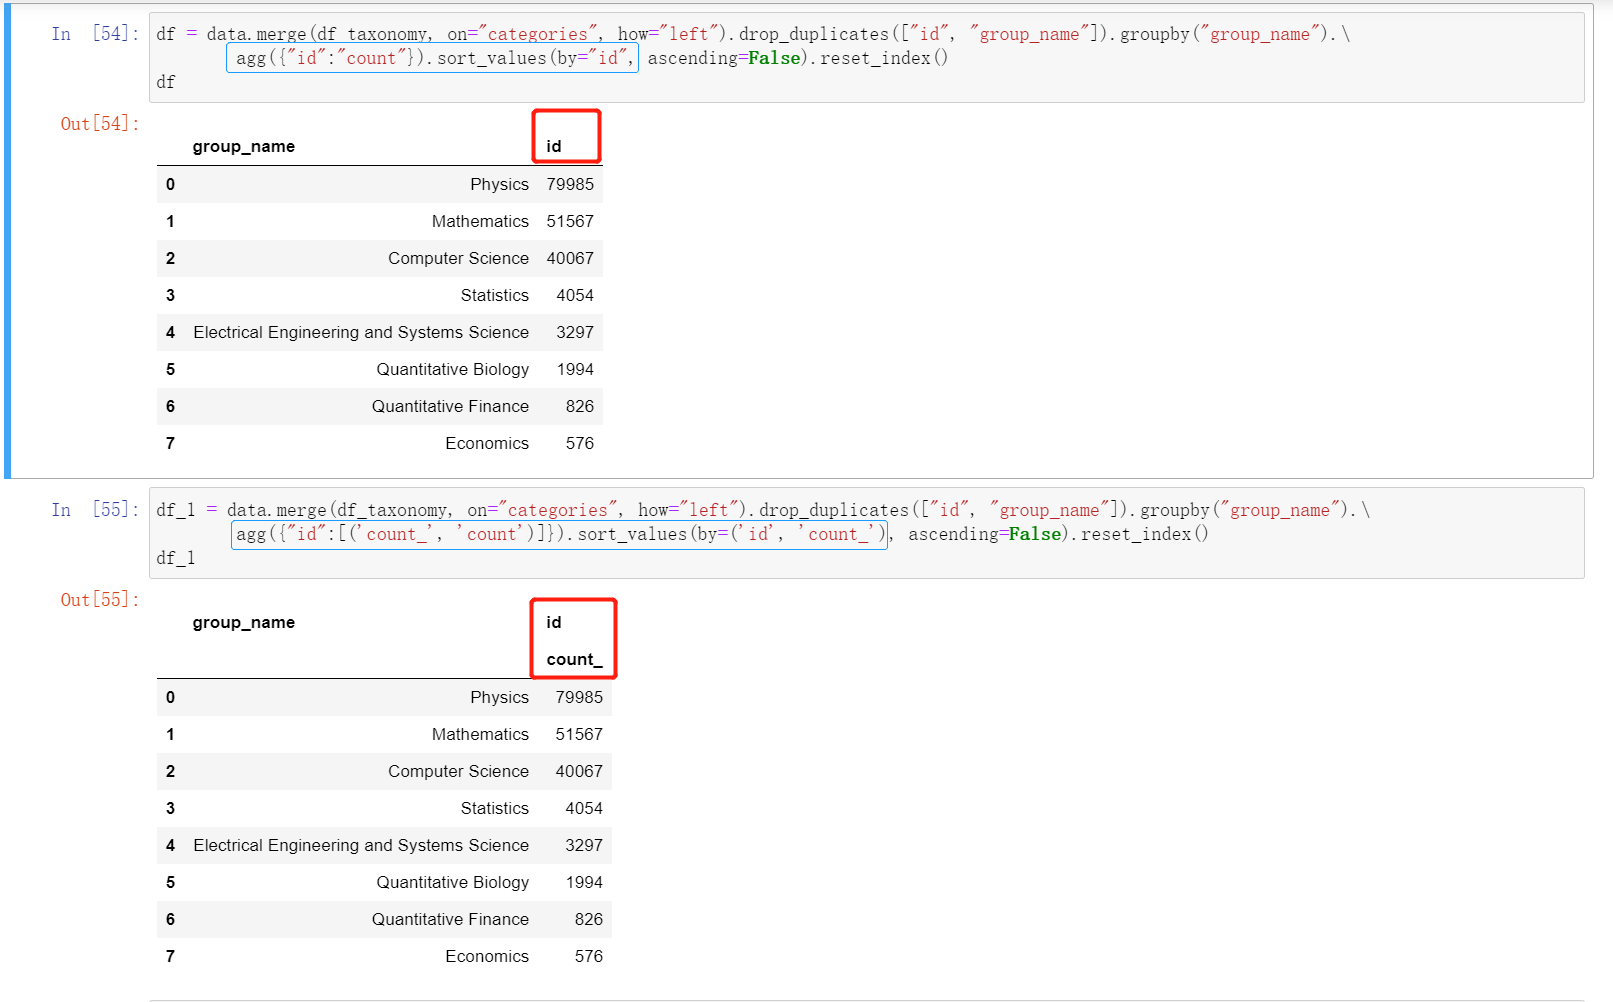
使用merge函数,以两个dataframe共同的属性 “categories” 进行合并,并以 “group_name” 作为类别进行统计,统计结果放入 “id” 列中并排序。
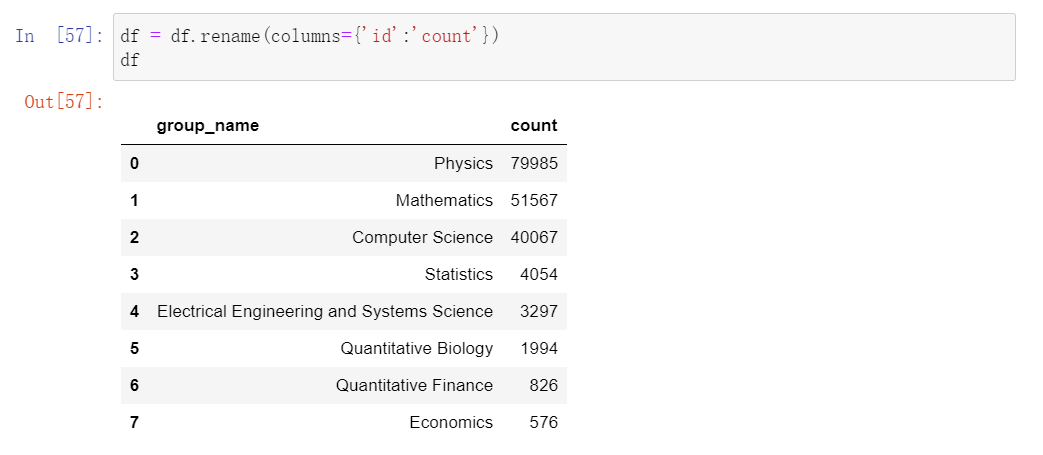
agg 用于自定义分组的聚合方法,可以通过 agg 对内置函数名进行修改,但是不能去修改列名,修改后会变成多维。如果需要修改列名,使用 rename 就好了。
df.rename()
figure,axes(subplot),axis的区别
figure/fig 空白画布
- figure
figure是图像的载体,使用
plt.figure()创建,一个程序可以创建多个画布,画图操作作用于最近创建的画布上, 多个画布顺序显示。
ax单个坐标系 / axes 复数坐标系
- axes (subplot)
坐标系,可理解为画布上的一个区域, 一个 figure 上可以有多个 axes ,被分成多个区域, 可用
plt.axes和plt.subplots/plt.subplot来创建,plt画图操作本质就是操作 axes 对象,。
axis 坐标轴
- axis
坐标轴,画的图都是基于坐标轴的
确定一种风格就可以,我比较习惯可常用的是 fig, ax = plt.subplots(),好处是,我可以任意添加子图,通过调整子图个数参数,方便将多个图画在一张画布上。
fig, ax = plt.subplots(figsize=(15,12))
explode = (0, 0, 0, 0.2, 0.3, 0.3, 0.2, 0.1)
ax.pie(df["count"], labels=df["group_name"], autopct='%1.2f%%', startangle=160, shadow=False, explode=explode)
ax.axis('equal')
plt.tight_layout()
plt.show()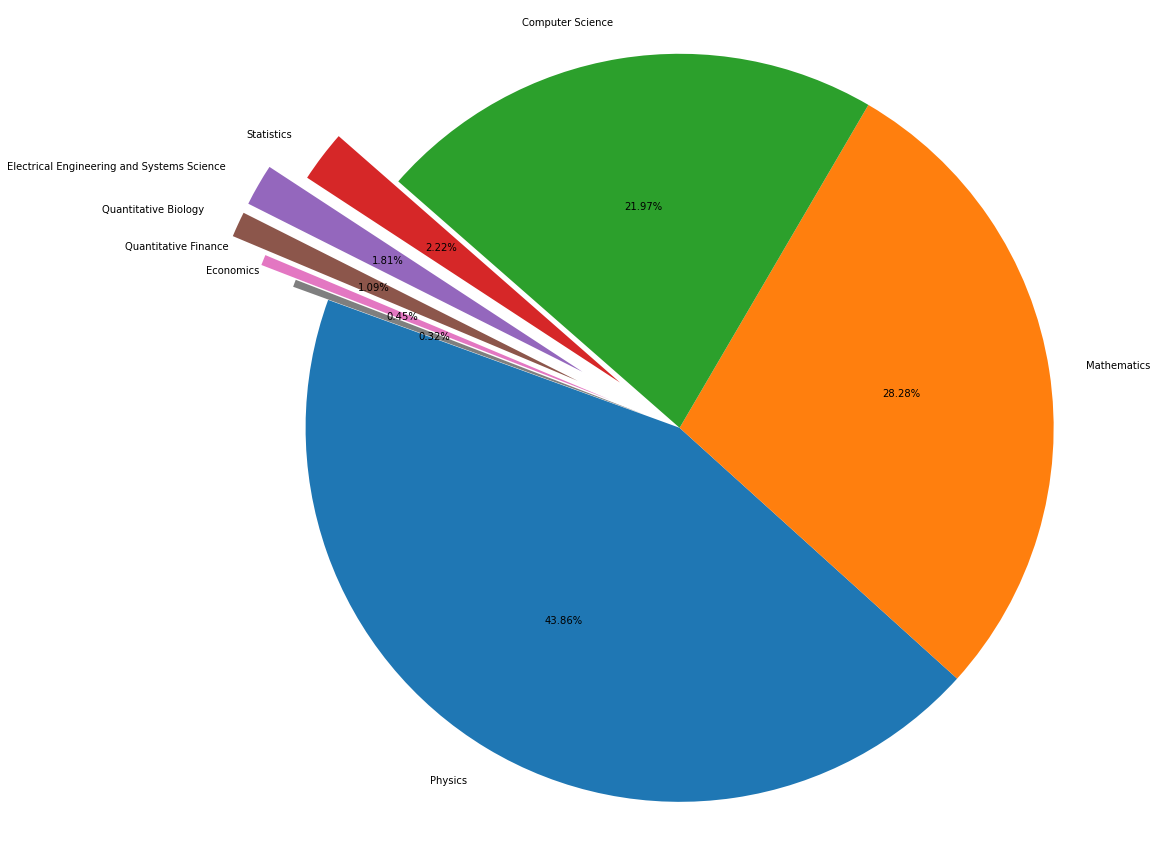
统计各领域 paper 数量
下面统计在计算机各个子领域2019年后的paper数量,我们同样使用 merge 函数,对于两个dataframe 共同的特征 categories 进行合并并且进行查询。然后我们再对于数据进行统计和排序从而得到以下的结果:
cat = cats.groupby(["year","category_name"]).count().reset_index().pivot(index="category_name", columns="year", values="id")
cat.sort_values([2020, 2019],ascending=False)| year | 2019 | 2020 |
|---|---|---|
| category_name | ||
| Computer Vision and Pattern Recognition | 5559 | 6517 |
| Computation and Language | 2153 | 2906 |
| Robotics | 917 | 1298 |
| Cryptography and Security | 1067 | 1238 |
| Data Structures and Algorithms | 711 | 902 |
| Software Engineering | 659 | 804 |
| Networking and Internet Architecture | 864 | 783 |
| Distributed, Parallel, and Cluster Computing | 715 | 774 |
| Artificial Intelligence | 558 | 757 |
| Human-Computer Interaction | 420 | 580 |
| Computers and Society | 346 | 564 |
| Machine Learning | 177 | 538 |
| Logic in Computer Science | 470 | 504 |
| Databases | 282 | 342 |
| Information Retrieval | 245 | 331 |
| Social and Information Networks | 202 | 325 |
| Computer Science and Game Theory | 281 | 323 |
| Programming Languages | 268 | 294 |
| Neural and Evolutionary Computing | 235 | 279 |
| Computational Geometry | 199 | 216 |
| Computational Engineering, Finance, and Science | 108 | 205 |
| Computational Complexity | 131 | 188 |
| Hardware Architecture | 95 | 159 |
| Digital Libraries | 125 | 157 |
| Graphics | 116 | 151 |
| Formal Languages and Automata Theory | 152 | 137 |
| Systems and Control | 415 | 133 |
| Multiagent Systems | 85 | 90 |
| Emerging Technologies | 101 | 84 |
| Discrete Mathematics | 84 | 81 |
| Other Computer Science | 67 | 69 |
| Multimedia | 76 | 66 |
| Performance | 45 | 51 |
| Mathematical Software | 27 | 45 |
| Symbolic Computation | 44 | 36 |
| Operating Systems | 36 | 33 |
| Numerical Analysis | 40 | 11 |
| General Literature | 5 | 5 |
| Sound | 7 | 4 |
我们可以从结果看出,Computer Vision and Pattern Recognition(计算机视觉与模式识别)类是CS中paper数量最多的子类,遥遥领先于其他的CS子类,并且paper的数量还在逐年增加;另外,Computer Vision and Pattern Recognition(计算机视觉与模式识别)、Computation and Language(计算与语言)、Robotics(机器人学)以及Cryptography and Security(密码学与安全)四个领域排名前四,并且 Paper 数量都超过1000,这与我们的认知是一致的。
相关资料
列表推导式:第一章 预备知识 — Joyful Pandas 1.0 documentation (datawhale.club)
python 普通循环、列表推导式、map()函数三者效率的对比
pandas.DataFrame.agg — pandas 1.2.0 documentation (pydata.org)
第二章 pandas基础 — Joyful Pandas 1.0 documentation (datawhale.club)